As we discussed in our previous article, a majority of executives (63%) believe that their organization is ineffective at pipeline management, while a majority of Sales reps (54%) feel that their pipeline is inaccurate.
All this suggests that we need to work on our pipeline management skills, especially if we want to set our Sales team up for success and enable them to work the right leads and to work toward predictable growth.
In that last article, we posed these 6 tips for improving pipeline management:
- Clearly define your funnel and sales process
- Align your sales process with the Buyer’s Journey
- Take time to manage your pipeline
- Watch for leaks in the pipeline
- Tie all efforts to revenue
- By analytical
While we still stand by all of these, we thought we would add a little more detail to “Be analytical.” While a list of metrics is great, we also wanted to offer an explanation of each, as well as an explanation of how to apply them in your sales pipeline management.
So without further ado, here are the 6 metrics you should keep in mind when monitoring and watching your pipeline.
1. Qualified Leads
More than just the number of contacts you’ve got in your database, this number represents the leads that have expressed a high level of interest in your product or service by requesting a demo, a consultation, or a quote, or by taking another action your team deems to be “qualifying.” Ideally, with the help of Marketing and lead generation, this number should steadily increase over time.
2. Conversion Rates
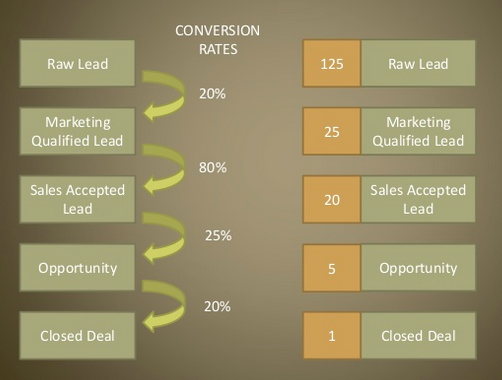
Your conversion rates are also important, as they indicate how many contacts move from one stage to the next. By benchmarking rates and comparing your performance, you can see where the weak points in your pipeline are. Additionally, by starting with how many new closed deals you set as your goal, you can work backward with your conversion rates in mind and can calculate how many new leads you will need. This allows you to calculate and plan marketing goals and to determine the number of contacts needed at each stage to reach revenue goals.
For a visualization of this process, check out the graphic below, from David Skok’s recent SlideShare:

3. Win Rate
Similar to conversion rates, the win rate tells you how many leads are converted into actually closed deals, and this can be measured at each stage of your pipeline. How many opportunities do you typically need to see one closed deal win? How many SQLs for one closed deal win? How many MQLs? The buying experience is more complex today, and monitoring your win rates and conversion rates will allow you to find the churn in your funnel.
4. Opportunity Dollar Size vs. Average Won Deal Size
When looking at one particular opportunity, though, consider this metric. How big is the opportunity deal size? Is it about the same as your average won deal? Or is it bigger? If it’s bigger, does this mean that it will be less likely to close? Find your sweet spot and target customers there. Typically, when opportunities are considerably larger than your average deal, the odds of closing it decrease.
5. Opportunity Age vs. Win Cycle
Similarly, how long has the lead been in your pipeline? Longer than the average closed deal cycle? Typically, just as in #2, when opportunities wait longer than your average deal does, the odds of closing decreases.
6. Sales Cycle Length
This metric represents how long it takes for a contact to move through the entire pipeline and become a customer, from initial contact to closed deal. Ideally, this metric should decrease over time or stay about the same, depending on your industry. By monitoring the length of your Sales cycle, and at the length a lead spends at each stage, you can find where the lags are and work toward removing them.
How to Use Those Metrics
This is a diverse set of metrics, and each tells you something different. Some of these metrics will help you identify the overall efficiency of your Sales pipeline (like Qualified Leads and Sales Cycle Length), some will help you drill down into different stages (Conversion Rates and Win Rates), and some will help you analyze individual deals (Opportunity Dollar Size vs. Average Won Deal Size and Opportunity Age vs. Win Cycle).
As noted in our previous post, Sales managers should invest the time into monitoring and managing the Sales Pipeline. However frequently your team decides to do so, whether it’s weekly, bi-weekly, or monthly, consider each of these metrics at each check-in, and watch how they change over time. Monitoring these metrics and working to improve them will help establish a systematic way of bolstering your pipeline.


